Chapter 6
Trading with Moving Averages
In 2008, amid one of the worst financial crises in modern history, a trader quietly ignored the noise.
He wasn’t making bold predictions. He wasn’t watching news tickers or trying to call the bottom. Instead, he followed a single rule: watch the 200-day moving average. When the market dipped below it, he stepped aside. When it crossed back above, he re-entered. He didn’t outsmart the market—but he survived it. And by simply staying on the right side of the trend, he came out ahead when many others didn’t.
This is the often-overlooked power of trading with moving averages: not to predict the future, but to participate intelligently in the present.
And he wasn’t alone.
Some of the world’s largest funds, managing billions of dollars, quietly rely on the same tools. When the 50-day SMA crosses the 200-day SMA, it doesn’t just show up in textbooks—it moves headlines. Algorithms react. Retail and institutional traders alike lean in.
Why? Because moving averages reflect more than math—they reflect consensus. They are where data meets psychology, and simplicity meets significance.
In this chapter, we’ll go beyond definitions and calculations. You’ll learn how to trade with moving averages—both simple and exponential—and how to use them not as crystal balls, but as probability filters for trend, timing, and confidence.
6.1 How moving averages identify trends
Markets move in waves. Prices rise and fall in unpredictable bursts, often influenced by news, emotion, or sheer randomness. Amid this noise, it can be difficult to tell whether an asset is genuinely trending, or just oscillating.
That’s where moving averages come in.
A moving average helps traders identify the underlying direction of a market by smoothing out short-term fluctuations. Instead of reacting to every uptick or downtick, a moving average draws a clearer path through the data, making trends more visible and actionable.
The Core Idea
When the price of an asset is consistently above its moving average, it suggests an upward trend. When it stays below the moving average, it indicates a downward trend. A flattening moving average, on the other hand, can signal a period of consolidation or range-bound movement.
- If price remains above the moving average and the average is sloping upward, it often reflects a strong uptrend.
- If price falls below the moving average and the average is sloping downward, it often signals a developing downtrend.
Different Timeframes, Different Trends
Moving averages can be calculated over different time windows — 10-day, 50-day, 200-day, etc. — and each tells a different story:
- Short-term moving averages (e.g., 10-day or 20-day) react quickly to price changes and are useful for spotting early trend shifts.
- Medium-term moving averages (e.g., 50-day) help identify intermediate trends.
- Long-term moving averages (e.g., 100-day or 200-day) offer a broader view of the market’s direction and are favored for spotting major reversals.
Why This Matters
Many traders make decisions based on what they believe the market will do next. Moving averages flip that script. They help you align with what the market is doing now. They don’t forecast — they follow. And in doing so, they help you trade with the trend rather than against it.
This simple principle — "the trend is your friend" — is at the heart of many successful strategies. Moving averages are one of the easiest and most effective ways to stay on the right side of that trend.
In the next section, we’ll explore two of the most iconic trend-based signals: the Golden Cross and the Death Cross.
6.2 Golden Cross and Death Cross
Two of the most well-known signals in moving average trading are the Golden Cross and the Death Cross. These crossover events are simple to identify, yet powerful enough to influence both retail traders and institutional investors.
What is a Golden Cross?
A Golden Cross occurs when a short-term moving average crosses above a long-term moving average. It is widely interpreted as a bullish signal — an indication that momentum is shifting upward and a potential uptrend is beginning.
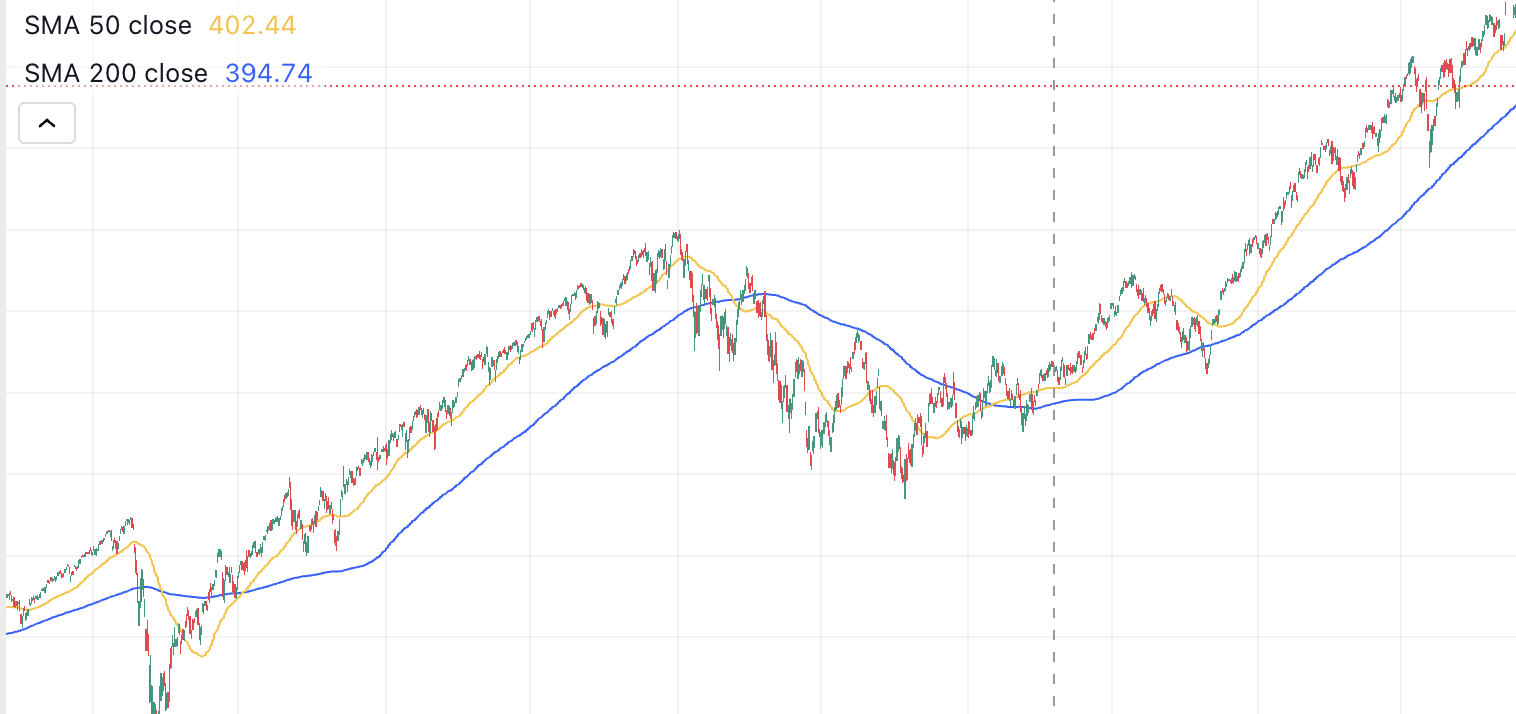
The most common Golden Cross setup uses the 50-day SMA crossing above the 200-day SMA. This signal is so influential that it often makes financial headlines and triggers algorithmic trades.
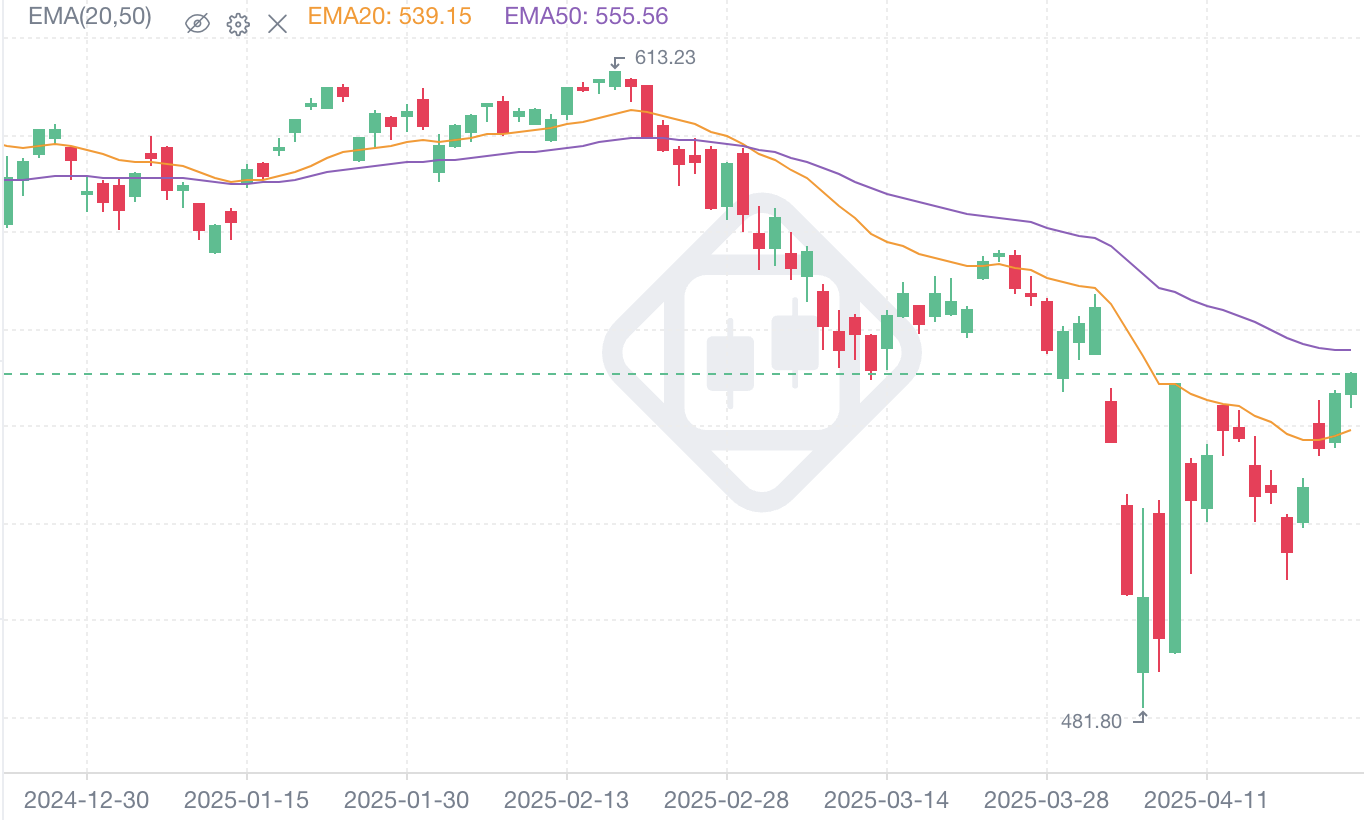
EMA version: Some traders prefer a faster version of this signal using the 20-day EMA crossing above the 50-day EMA. This setup provides earlier entries at the cost of more noise and possible false signals.
What is a Death Cross?
A Death Cross is the opposite of a Golden Cross — it occurs when a short-term moving average crosses below a long-term moving average. This is considered a bearish signal, suggesting that downside momentum is building and that a downtrend may be forming.
The classic Death Cross setup uses the 50-day SMA crossing below the 200-day SMA.
EMA version: For more sensitive strategies, traders may monitor the 20-day EMA crossing below the 50-day EMA to anticipate short-term trend reversals before longer-term SMAs confirm the move.
Why They Matter
Golden Crosses and Death Crosses are often seen as self-reinforcing events. Because they are followed by so many traders, the cross itself can generate buying or selling pressure that amplifies the trend.
These signals are especially effective when confirmed by other indicators, such as volume spikes, RSI levels, or trendlines. In practice, they are rarely used in isolation, but rather as components of broader strategies.
Limitations
While powerful, crossover strategies have their weaknesses:
- In sideways or choppy markets, crossovers can lead to whipsaws — frequent false signals that result in losses.
- Golden and Death Crosses tend to lag behind actual price reversals. By the time a cross occurs, a large portion of the move may have already happened.
Summary
| Signal | SMA Version | EMA Version |
| Golden Cross | 50-day SMA crosses above 200-day SMA | 20-day EMA crosses above 50-day EMA |
| Death Cross | 50-day SMA crosses below 200-day SMA | 20-day EMA crosses below 50-day EMA |
Whether you use SMAs for smoother, more stable signals, or EMAs for quicker reactions, crossover strategies are time-tested tools for trend detection. In the next section, we’ll explore how combining multiple moving averages can refine these signals even further.
A Note on Moving Average Periods
You may have noticed frequent mentions of 20-day, 50-day, or 200-day moving averages. These are commonly used benchmarks in the trading world, but it’s important to understand that they are not inherently superior or universally optimal.
The choice of moving average window is subjective. There is no single "best" period that fits all markets, timeframes, or strategies. The effectiveness of a moving average depends on:
- The timeframe you are trading (intraday vs. daily vs. weekly)
- The volatility and behavior of the asset
- Your trading objective (trend following, mean reversion, etc.)
For example, a 200-day SMA might work well for identifying long-term stock trends, while a 9-day EMA could be more effective for short-term crypto trading. Many successful traders arrive at their preferred moving average periods through backtesting and experience — not by defaulting to what everyone else uses.
That said, using standard values like 50-day or 200-day has its own merit: they are widely watched. Because these levels are visible to many market participants, they can become self-fulfilling support and resistance zones.
Bottom line: Don’t treat MA periods as sacred. Use them as starting points — then test, adjust, and adapt them to your own strategy and market conditions.
6.3 Using Multiple Moving Averages
In the previous section, we introduced the Golden Cross and Death Cross — two classic crossover signals built from simple moving averages. Now, we take that idea a step further: using multiple moving averages together to create more refined and adaptive trading systems.
No single moving average can perfectly capture every market move. Short-term averages react quickly but are prone to false signals. Long-term averages are more reliable but slower to respond. To balance these trade-offs, traders often layer moving averages of different speeds, allowing short-term momentum to be interpreted within the context of longer-term trends.
The most common structure is a simple crossover system:
- A bullish signal occurs when a short-term moving average crosses above a longer-term moving average.
- A bearish signal occurs when a short-term moving average crosses below a longer-term moving average.
This approach is called a dual moving average system. It lets the shorter average act as a trigger for action, while the longer average sets the broader trend direction.
You are not limited to using the same type of moving average for both lines. Some traders prefer the classic SMA/SMA crossover, such as the 50-day SMA crossing the 200-day SMA. Others use a faster EMA/EMA setup, like the 12-day EMA crossing the 26-day EMA — the foundation of the MACD indicator. A hybrid method — EMA/SMA — is also popular, combining the faster reaction of an EMA with the smoother trend signal of an SMA. For example, a 20-day EMA crossing a 100-day SMA provides quicker entry points while anchoring to a stable long-term trend.
Another powerful concept is the "alignment" or "stacking" of multiple moving averages. When several averages — such as the 20-day, 50-day, and 200-day — are all lined up in order (shortest above medium, medium above longest), it signals a strong, healthy trend. Many traders use this alignment as a filter, only taking trades that agree with the dominant direction.
Using multiple moving averages can also help reduce noise and avoid "whipsaws" — those frustrating moments when prices flip back and forth, triggering false signals. A single fast-moving average might cause you to jump in and out too often. But when you require confirmation from a slower-moving average, you filter out many of these false alarms and stay focused on higher-quality setups.
In short, combining moving averages is not about making things complicated. It’s about gaining clarity. By layering different timeframes together, you build a deeper, more reliable picture of market behavior — and you make decisions based on structure, not on noise.
6.4 Practical examples of moving average strategies
Understanding moving averages is one thing — using them effectively in real trading is another. In this section, we walk through practical examples that demonstrate how moving averages can be used for entries, exits, and filtering trades across different market conditions.
These strategies are not meant to be perfect or predictive. They are frameworks — starting points you can adapt, test, and refine to suit your personal trading style.
Example 1: Trend-Following with SMA Crossovers
Setup: 50-day SMA and 200-day SMA (classic trend-following system)
- Entry: Go long when the 50-day SMA crosses above the 200-day SMA (Golden Cross).
- Exit: Close the position when the 50-day SMA crosses below the 200-day SMA (Death Cross).
- Use case: Works well in trending markets, particularly with major indices like SPY.
Example 2: Short-Term Momentum with EMA Crossovers
Setup: 9-day EMA and 21-day EMA
- Entry: Go long when the 9-day EMA crosses above the 21-day EMA.
- Exit: Close the position when the 9-day EMA crosses back below the 21-day EMA.
- Use case: More responsive than SMA crossovers; suitable for swing traders or short-term positions.
Example 3: SMA Entry, EMA Exit
Setup: 100-day SMA and 20-day EMA
- Entry: Go long when price closes above the 100-day SMA.
- Exit: Close the position when price closes below the 20-day EMA.
- Use case: This setup enters on a confirmed long-term trend and exits quickly when short-term momentum fades — helping avoid large drawdowns.
Example 4: Moving Average as Trend Filter
Setup: 200-day SMA used as a directional filter
- Entry: Only take long trades if price is above the 200-day SMA.
- Exit: Use a separate short-term strategy, but ignore signals that go against the trend direction.
- Use case: Helps reduce false signals by trading only in the dominant trend direction.
Final Thought
At this point, we can’t yet say which of these strategies performs best — and that’s exactly the point. The effectiveness of each setup depends on the asset, timeframe, and market condition.
In the later chapters of this book, we’ll run extensive backtests to evaluate these strategies using historical data. You’ll see, with real numbers, which approaches have worked best in the past — and under what conditions they thrive or fail.