Chapter 4
Understanding Trends and Indicators
Imagine you’re standing on a beach, watching the waves roll in. Some are small, others are powerful. Occasionally, one surprises you — crashing harder or pulling back faster than expected. If you pay close attention, though, you’ll start to notice patterns. Maybe the waves are gradually growing stronger. Maybe the tide is rising. You’re no longer reacting to each splash — you’re reading the ocean.
Financial markets are a lot like that shoreline. Every tick of the chart is a wave — noisy, unpredictable, sometimes deceptive. But behind those short-term ripples lie deeper currents: upward trends, downward reversals, periods of calm, and sudden surges. Traders who learn to observe these currents — instead of just the waves — gain an enormous advantage.
That’s where trend analysis and indicators come in. They don’t predict the future — no tool can — but they help you make sense of what the market is doing now. They help you ask better questions: Is this move real or a fakeout? Are others buying into this trend? Is momentum building or fading?
In this chapter, we’ll explore what market trends are, how to tell the difference between bullish and bearish environments, and how indicators like volume, RSI, and MACD can help you make more confident, data-informed trading decisions.
4.1 What are Market Trends?
A market trend refers to the general direction in which the price of an asset or the overall market is moving over a period of time. Trends can move upward, downward, or sideways — and understanding them is a foundational skill for every trader and investor.
In simple terms, a trend is like the path a hiker takes up or down a mountain. If the trail is sloping upward, that’s an uptrend. If it’s heading downward, that’s a downtrend. And if the trail levels out for a while, that’s a sideways trend — also known as a consolidation phase.
Three Main Types of Trends
- Uptrend (Bullish): Prices are generally rising over time, forming a series of higher highs and higher lows. This is typically a sign of growing investor confidence.
- Downtrend (Bearish): Prices are generally falling, forming lower highs and lower lows. This often reflects pessimism or fear in the market.
- Sideways Trend (Range-bound): Prices move within a relatively narrow range, without a clear upward or downward direction. These periods often precede breakouts.
Why Trends Matter
Trends help traders align with the direction of the market rather than fight against it. Trading in the direction of a well-established trend generally increases the probability of success. Trying to go against a trend — for example, buying in a downtrend or shorting in an uptrend — is usually much riskier unless you have strong reasons and tight risk control.
Identifying trends early can also help with timing: knowing when to enter, when to stay out, and when to lock in profits. Whether you’re trading short-term moves or investing for the long haul, trends provide the context that gives your decisions meaning.
In the next section, we’ll learn how to recognize bullish and bearish trends using both price patterns and supporting tools.
4.2 Identifying Bullish and Bearish Trends
Recognizing whether the market is in a bullish (rising) or bearish (falling) trend is one of the most important skills in trading. It helps you decide whether to buy, sell, or stay out. Instead of reacting emotionally to price moves, you’ll be able to act based on the broader direction of the market.
Bullish Trends
A bullish trend is when prices are generally moving upward over time. You’ll often see a series of higher highs (each peak is higher than the last) and higher lows (each pullback doesn’t drop as far as the previous one). This indicates growing demand, rising confidence, and positive momentum in the market.
Common signs of a bullish trend:
- Price consistently closes above support levels.
- Moving averages (like the 50-day or 200-day EMA) slope upward.
- The asset forms higher highs and higher lows on the chart.
- Indicators like RSI remain in the 50-70 range without dipping below.
Bearish Trends
A bearish trend is the opposite — prices are generally falling over time. The chart shows a series of lower highs and lower lows. Sellers are in control, and investors are pulling out or betting against further gains.
Common signs of a bearish trend:
- Price regularly fails to hold above resistance levels.
- Moving averages slope downward or price remains below them.
- The asset forms lower highs and lower lows.
- RSI stays in the 30-50 range or drops into oversold territory.
Trend Strength and Confirmation
It’s not enough to spot a single higher high or lower low — trends are confirmed when patterns are consistent and supported by volume and momentum. A trend becomes stronger if it’s backed by high trading volume. Weak trends may reverse quickly, especially during uncertain market conditions.
Caution: Trends Can Be Tricky
Trends don’t last forever, and the market doesn’t always move in straight lines. There will be pullbacks in bullish trends and rallies in bearish ones. These are called corrections or retracements, and they can confuse new traders. That’s why it’s important to use a combination of price action and technical indicators to confirm the overall trend before making decisions.
In the next section, we’ll explore how technical indicators can help you confirm trends and spot potential changes in market direction more effectively.
4.3 Importance of Indicators in Trading
Indicators are tools that help traders make sense of price action. While charts show what the market is doing, indicators help explain how strong that movement is, whether it’s likely to continue, and whether it might be reaching a turning point.
Relying only on price can be misleading — especially in volatile markets. A stock might jump quickly on a piece of news, only to reverse hours later. Indicators help filter out noise and provide additional context for smarter decisions.
What Indicators Actually Do
Indicators don’t predict the future. Instead, they measure different aspects of market behavior based on past price and volume data. Some indicators highlight momentum, others show trend direction, and some warn of possible reversals. Together, they give you a more complete picture.
Here’s what indicators can help with:
- Confirming a trend: Is the current uptrend or downtrend strong and healthy?
- Signaling entry and exit points: Is now a good time to get in or get out?
- Spotting potential reversals: Is momentum fading? Is the trend losing steam?
- Measuring volatility: Are prices moving steadily, or is the market becoming unpredictable?
Categories of Indicators
Most indicators fall into one of these broad categories:
- Trend-following indicators: Show the direction and strength of a trend. Examples include Moving Averages and MACD.
- Momentum indicators: Help identify overbought or oversold conditions. Examples include RSI and Stochastic Oscillator.
- Volume-based indicators: Measure buying and selling activity. Examples include Volume, OBV (On-Balance Volume), and Accumulation/Distribution.
- Volatility indicators: Gauge how much and how quickly prices are moving. Bollinger Bands and ATR (Average True Range) are common.
Why This Matters for You
Indicators act as your trading dashboard. Just like a pilot wouldn’t fly a plane without checking their instruments, a trader shouldn’t rely on price alone. The right mix of indicators can keep you focused, reduce emotional decision-making, and give you the confidence to act — or wait — based on clear signals.
That said, no indicator is perfect. Many traders find success by combining a few key indicators that complement each other, rather than chasing too many at once.
In the next section, we’ll look at some of the most commonly used indicators — like RSI, MACD, and volume — and how each can enhance your understanding of the market.
4.4 Common Indicators: Volume, RSI, MACD, etc.
There are hundreds of technical indicators out there, but only a handful are commonly used by successful traders. In this section, we’ll explore a few of the most important ones — the ones that show up in nearly every charting tool and trading strategy.
Note
Moving averages — including the Simple Moving Average (SMA) and Exponential Moving Average (EMA) — are fundamental tools in technical analysis. Because they play such an important role, they are discussed separately in their own dedicated chapters. This section focuses on other commonly used indicators.
Volume
Volume tells you how many shares (or contracts) were traded during a given period. It doesn’t predict price direction, but it reveals how strong or weak a move is. Generally, the more volume behind a price movement, the more meaningful that move is.
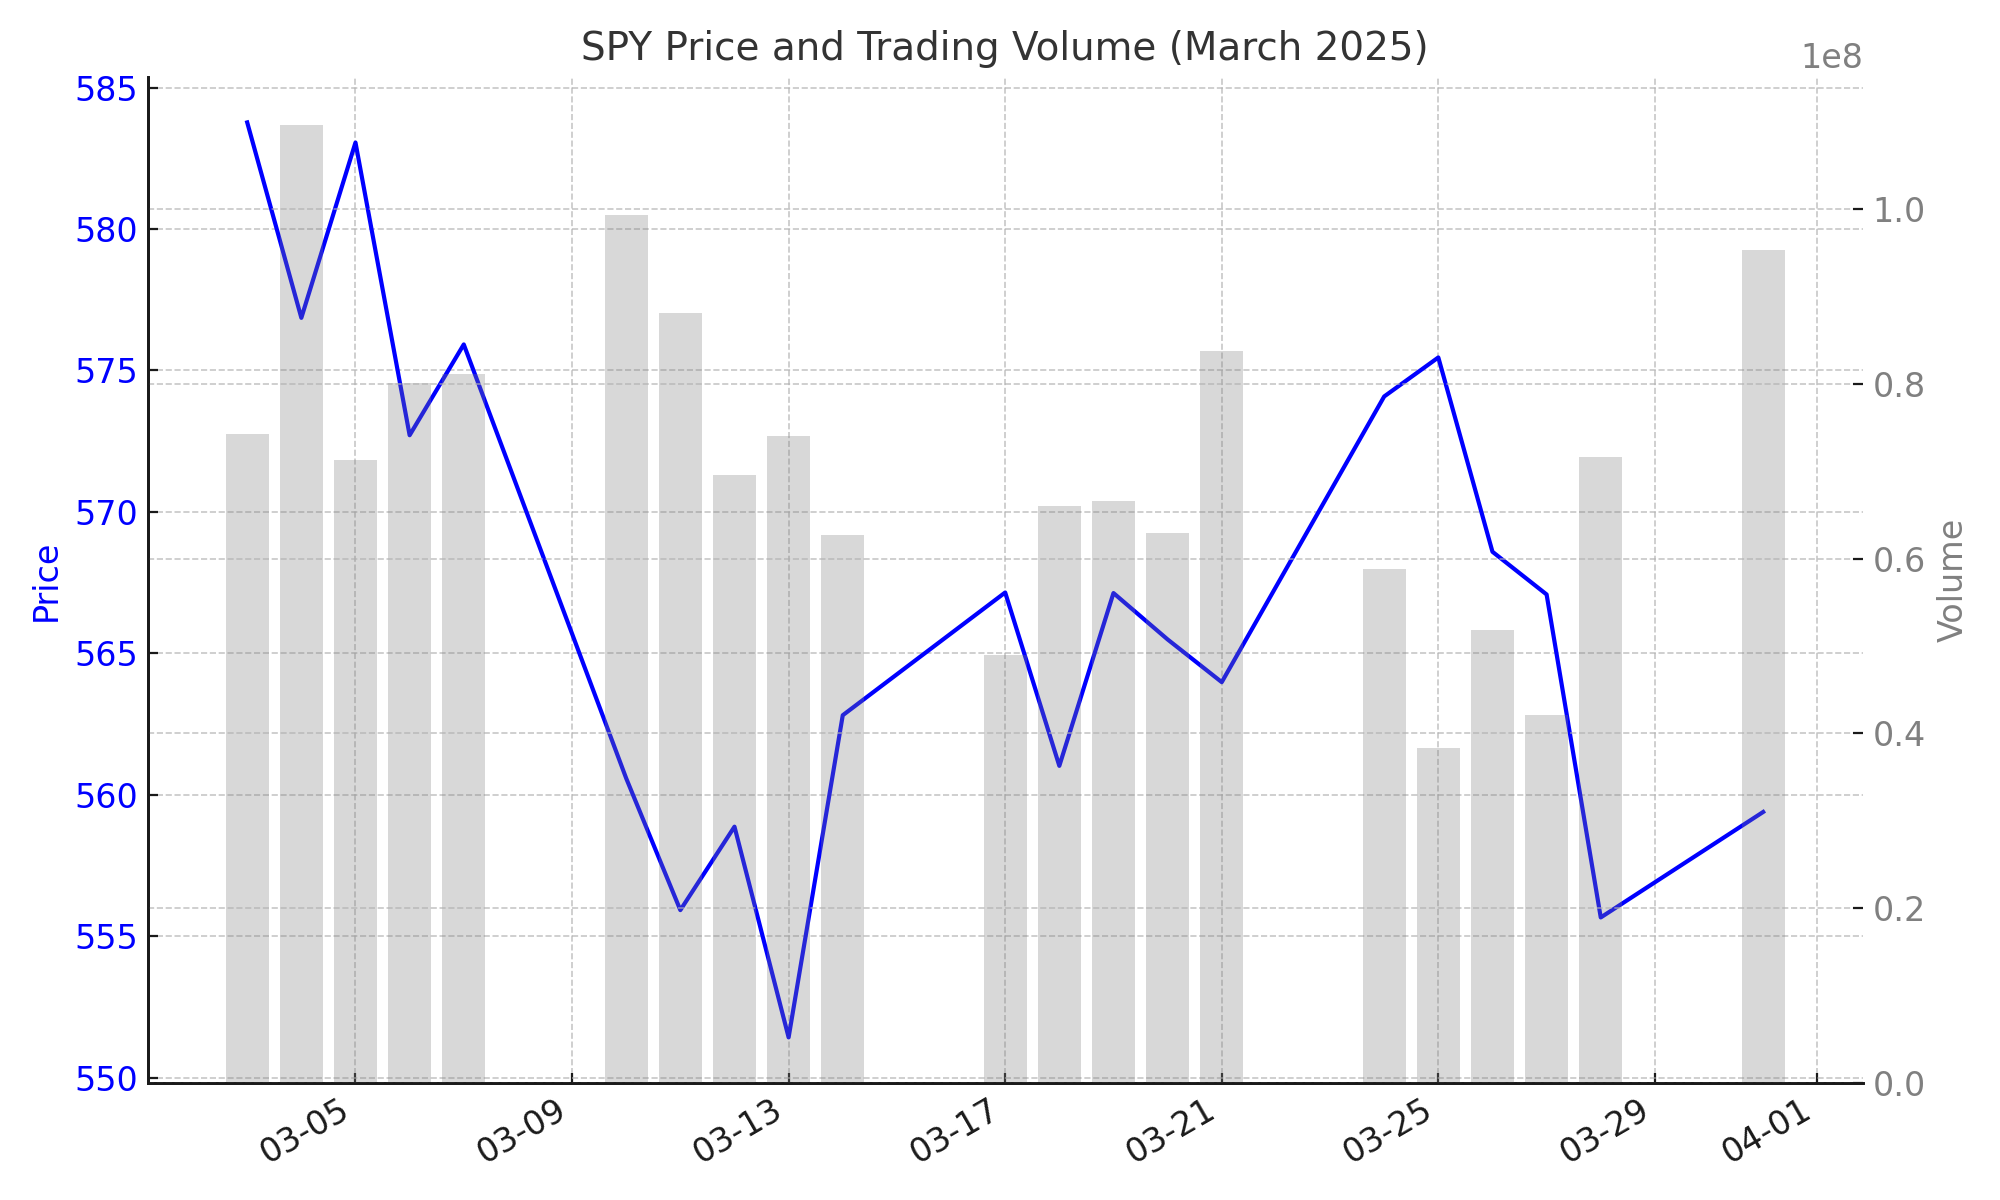
How traders use it:
- Rising prices with rising volume = strong bullish signal.
- Falling prices with rising volume = strong bearish signal.
- Rising prices with low volume = weak rally, may lack conviction.
Volume is often used to confirm breakouts, validate trend strength, and spot divergence between price action and market participation.
RSI (Relative Strength Index)
The Relative Strength Index measures how fast and how far prices have moved recently. It ranges from 0 to 100 and is typically used to identify overbought or oversold conditions.
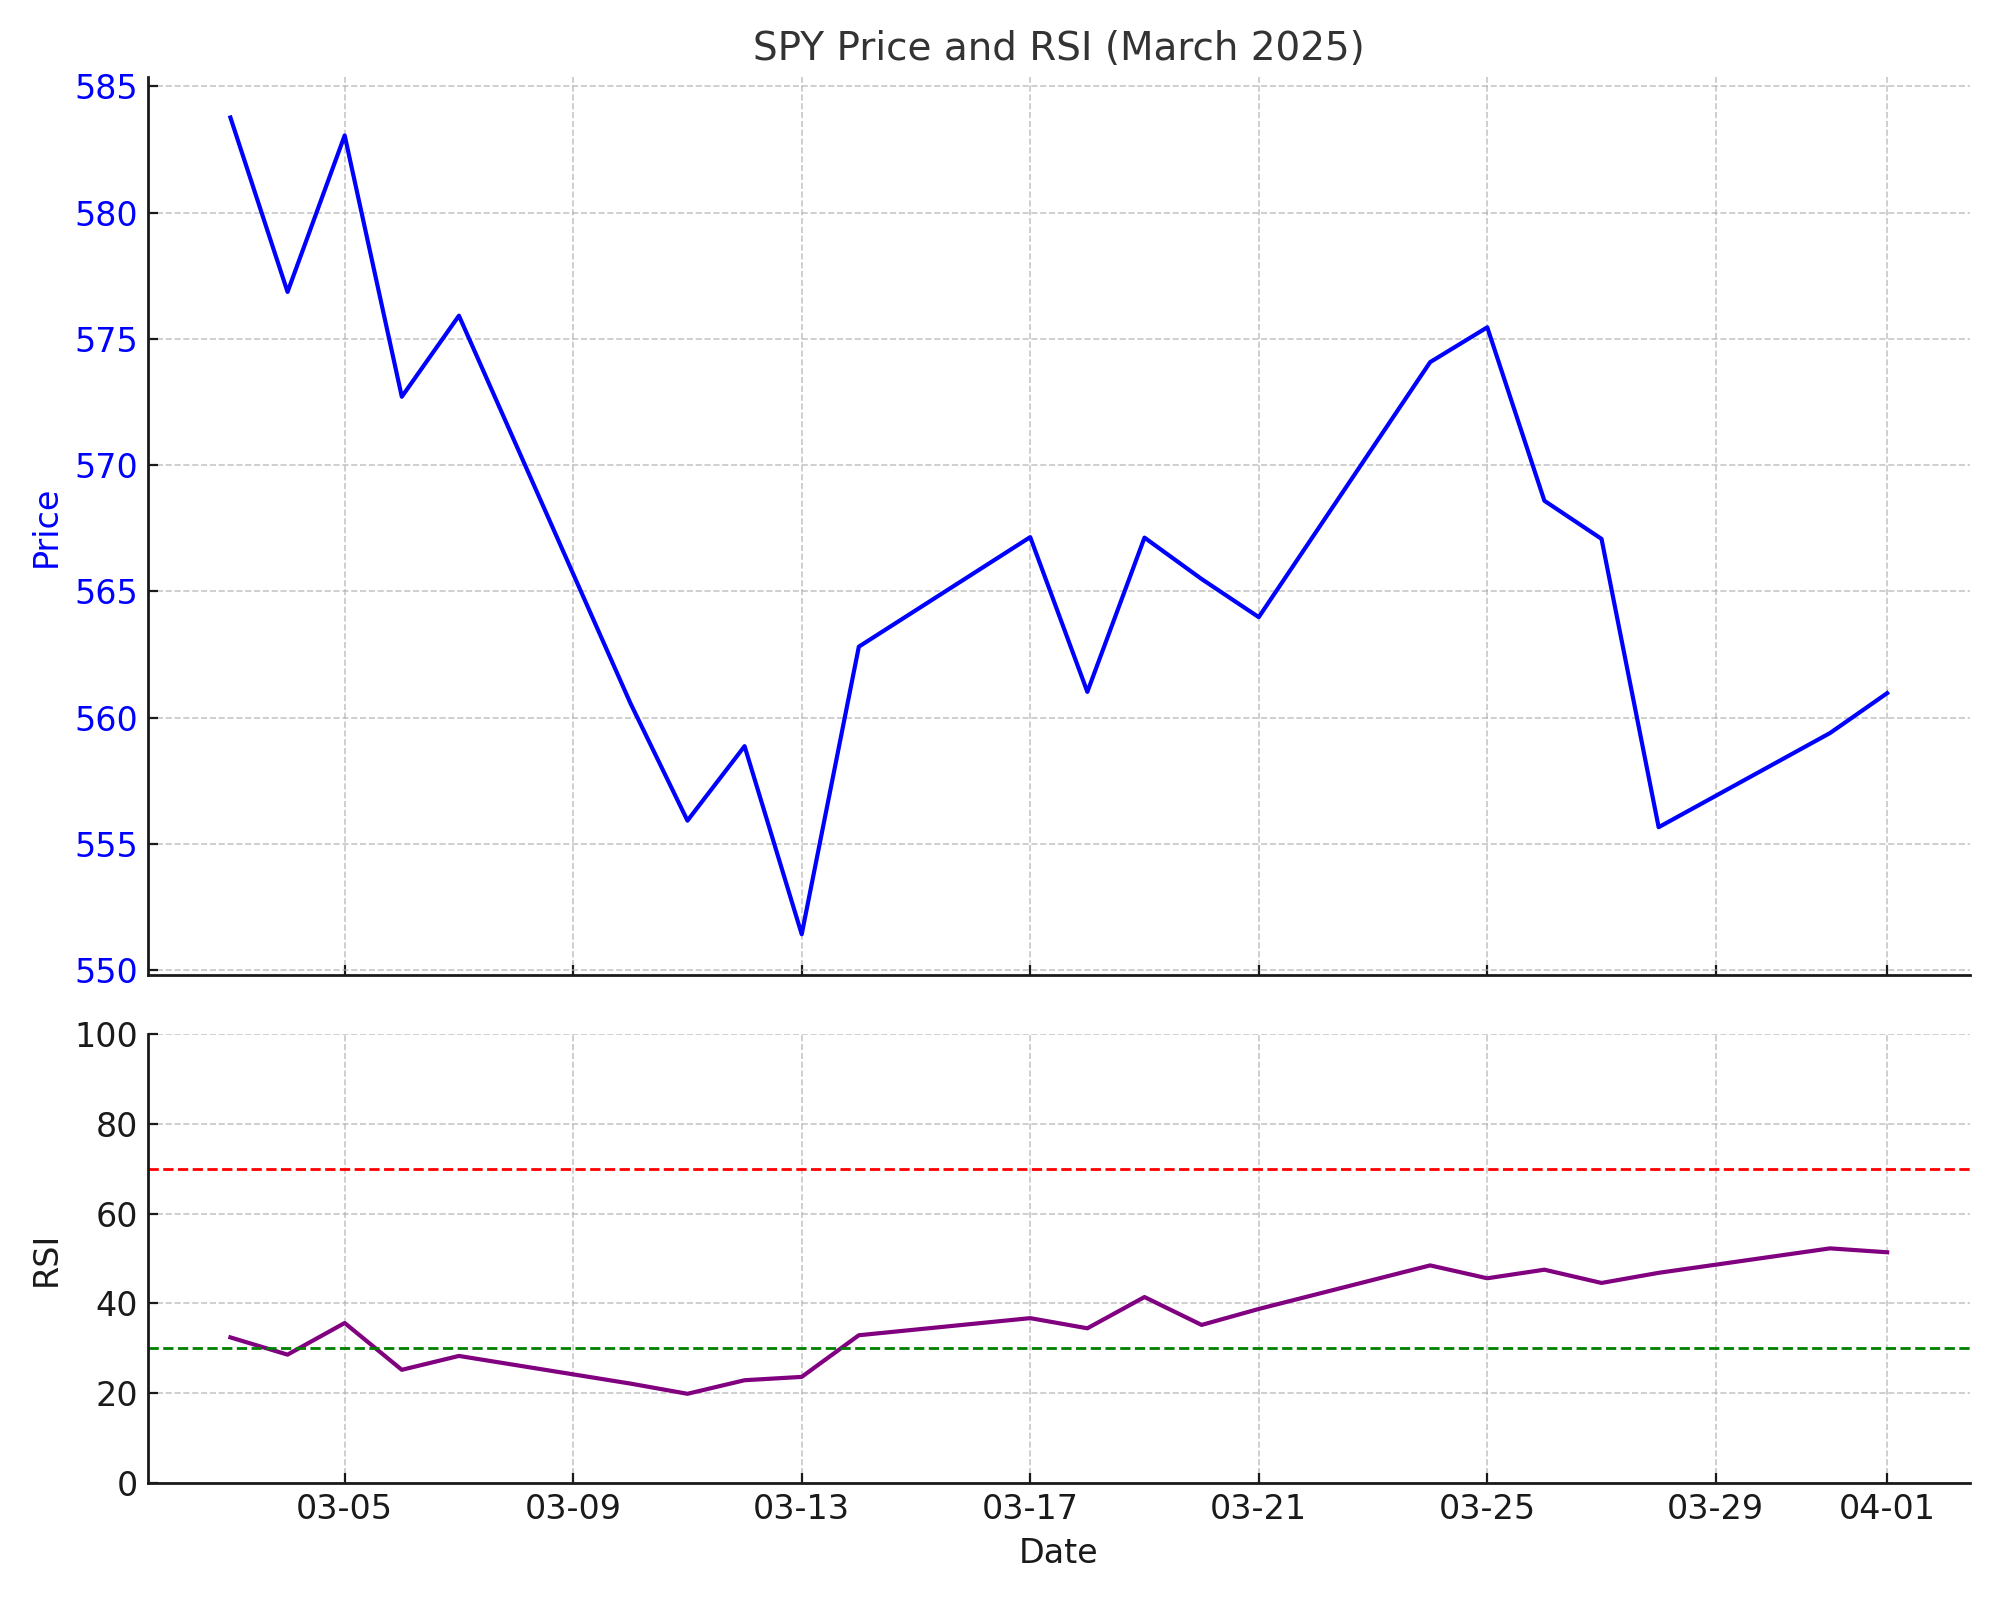
Key levels:
- RSI above 70 = possibly overbought (may pull back soon).
- RSI below 30 = possibly oversold (may bounce soon).
RSI is great for identifying potential reversals or confirming momentum in an existing trend.
MACD (Moving Average Convergence Divergence)
MACD is a momentum indicator that shows the relationship between two moving averages. It consists of the MACD line, a signal line, and a histogram that measures the distance between the two.
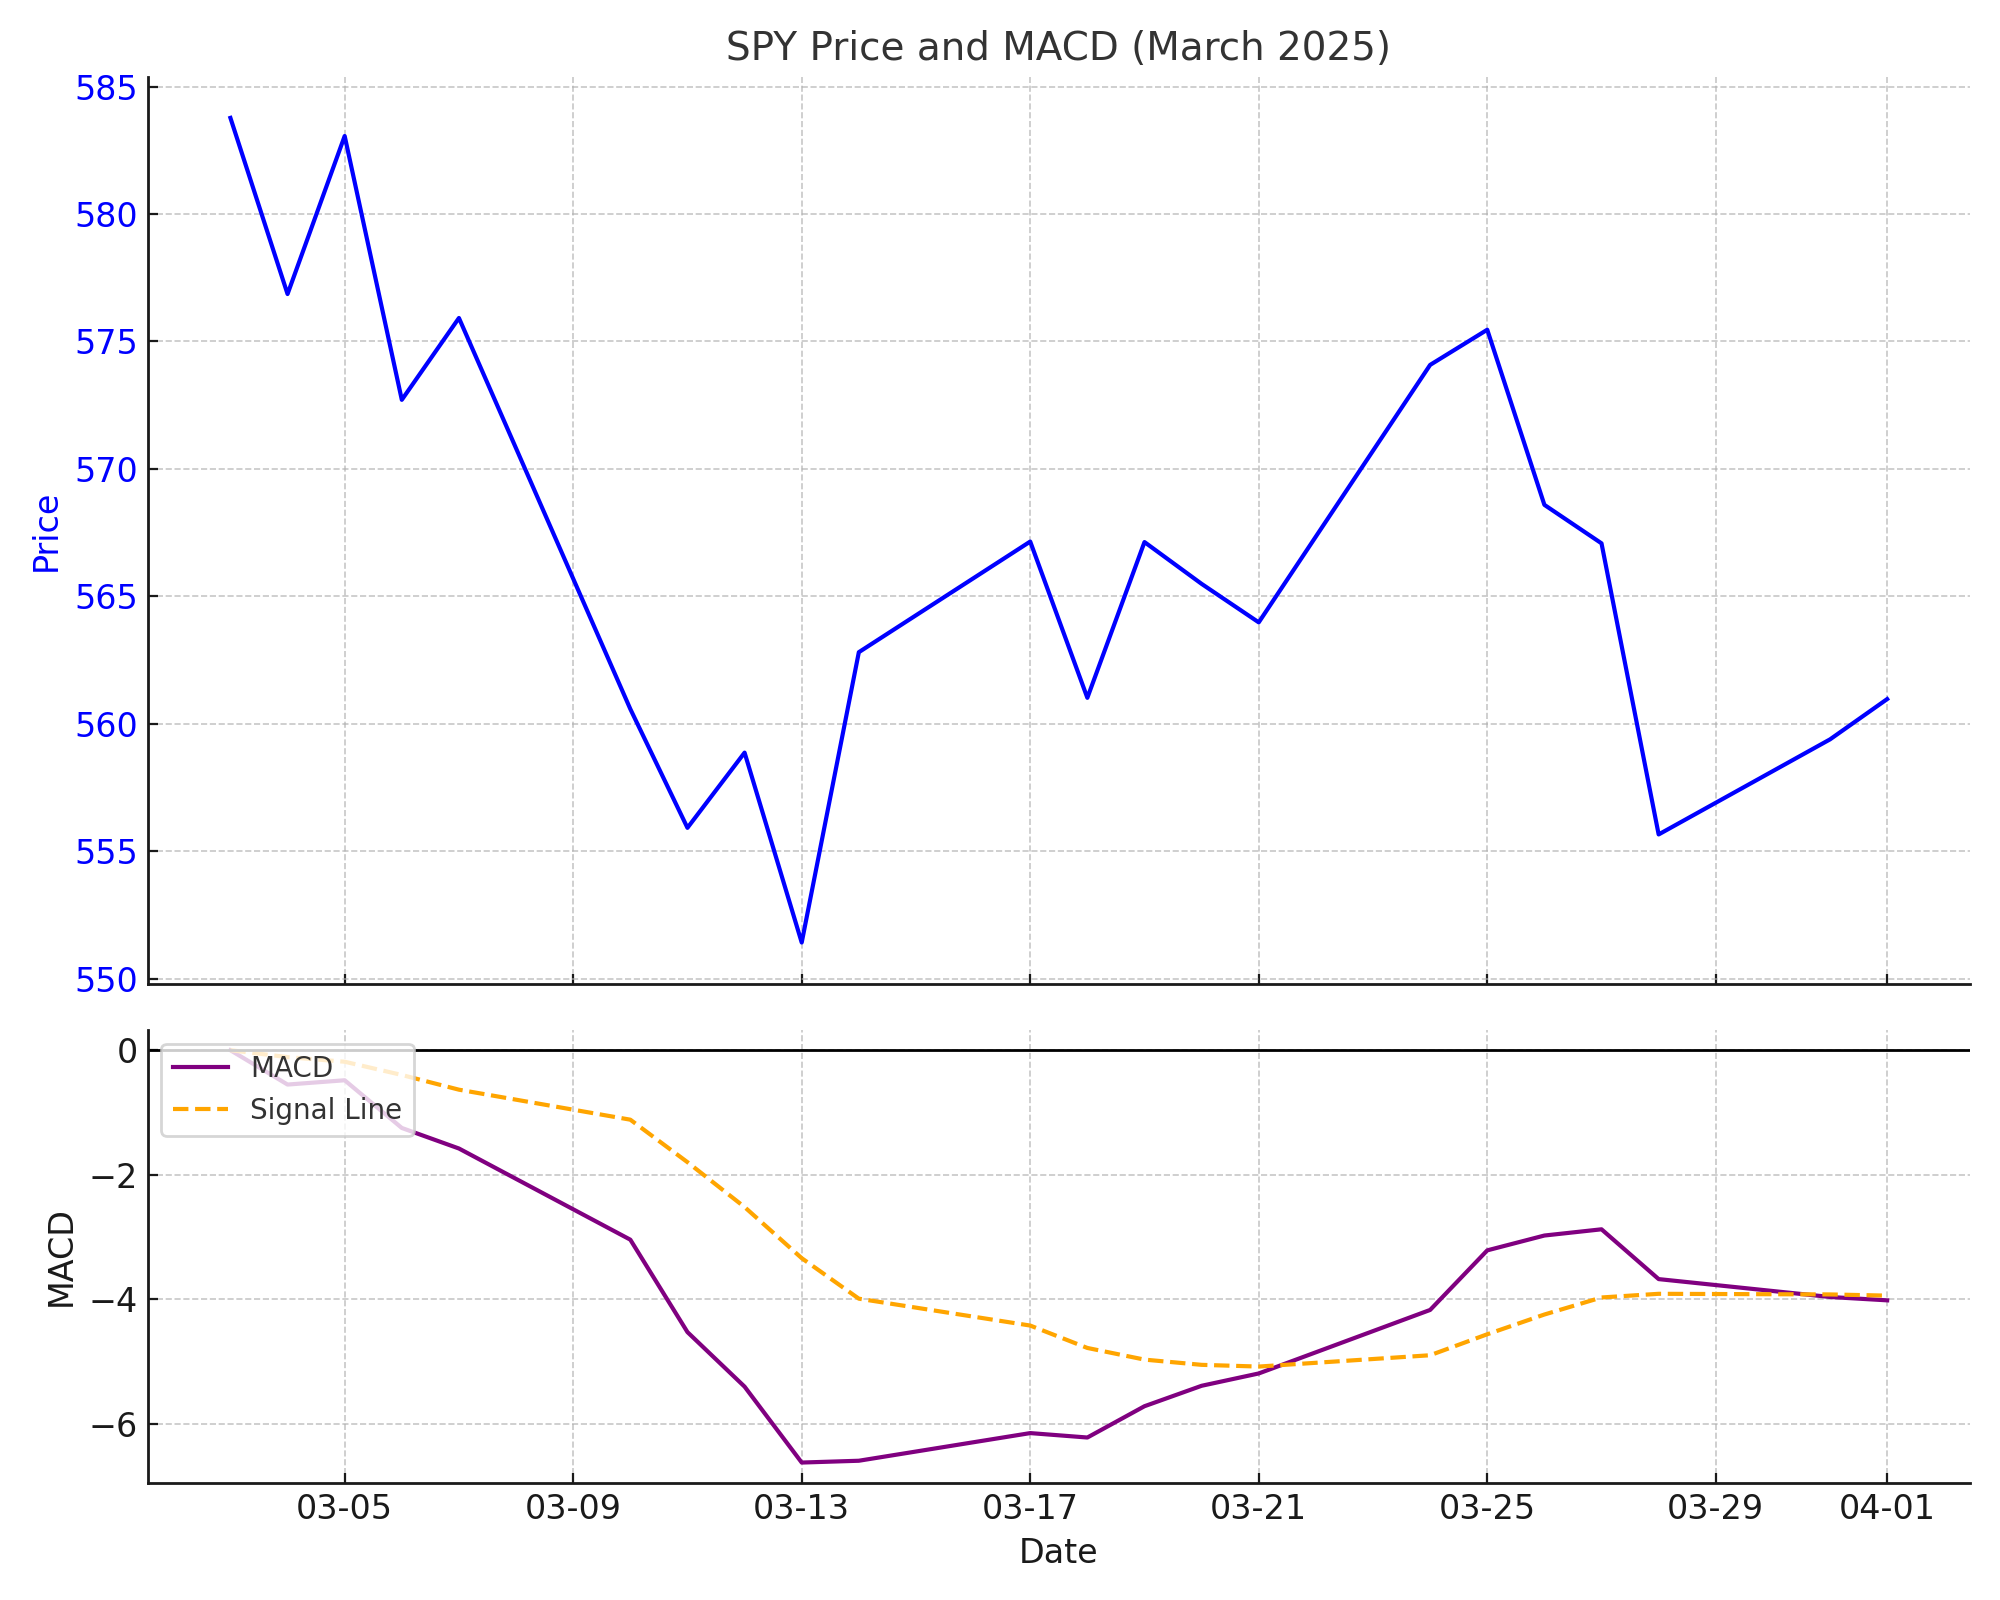
How traders use MACD:
- MACD crossing above the signal line = bullish.
- MACD crossing below the signal line = bearish.
- Divergence between MACD and price = early sign of reversal.
MACD is especially useful for identifying trend changes and confirming entry or exit points in medium- to long-term trades.
Other Indicators Worth Noting
- Bollinger Bands: Measure volatility. When bands expand, the market is volatile; when they contract, the market is quiet. Price touching or exceeding a band often signals a reversal or breakout.
- Stochastic Oscillator: Similar to RSI, it shows overbought and oversold levels, but reacts more quickly. Traders use it for spotting short-term reversals.
- ATR (Average True Range): Measures market volatility. Higher ATR means bigger daily price swings. It’s often used to set stop-loss distances.
Choosing the Right Indicators
No single indicator works in all conditions. The key is to combine a few that serve different purposes — for example, one for trend, one for momentum, and one for confirmation. Used properly, indicators can enhance your strategy, reduce uncertainty, and help you time your trades more effectively.
4.5 Limitations of Indicators
Indicators can enhance trading decisions, but they are not crystal balls. They are based on historical data and naturally lag behind price. By the time an indicator signals a move, the market may already have shifted.
No indicator is 100% reliable. Markets are influenced by news, emotions, and unexpected events — things no formula can predict. Even the best indicators will occasionally give false signals.
Using too many indicators can create confusion rather than clarity. Many tools overlap, showing the same information in slightly different ways, which can lead to conflicting signals or overtrading.
Indicators are most useful when combined with broader market context — like trends, support and resistance levels, volume, and price action.
Finally, be cautious about over-optimizing indicator settings to fit past data. Perfect backtests often fail in real markets because conditions constantly evolve.
Key principles for using indicators wisely:
- Use a few trusted indicators, not too many.
- Understand what each indicator measures.
- Combine indicators with market context.
- Prioritize simple, disciplined strategies over complicated ones.
In short, indicators are valuable tools — but they are guides, not guarantees.
In this chapter, we’ve explored the role of trends and technical indicators in understanding market behavior. Indicators like volume, RSI, and MACD help traders analyze momentum, confirm price action, and identify possible entry or exit points. Among all available tools, one of the most widely used and time-tested categories is moving averages.
Moving averages not only help visualize trends but also form the basis for powerful trading signals. Because of their importance and versatility, we dedicate the next chapter entirely to understanding how to trade with moving averages — including single and multiple average strategies, trend crossovers, and practical EMA-based systems.